
Dr. Moretti’s Mathematica Notebooks – Trigonometry
Mathematica Notebooks for Trigonometry
Important Note: The links for the notebooks open a new window or tab with a Google Drive page – the current settings for our homepages won’t allow me to host mathematica notebooks locally.
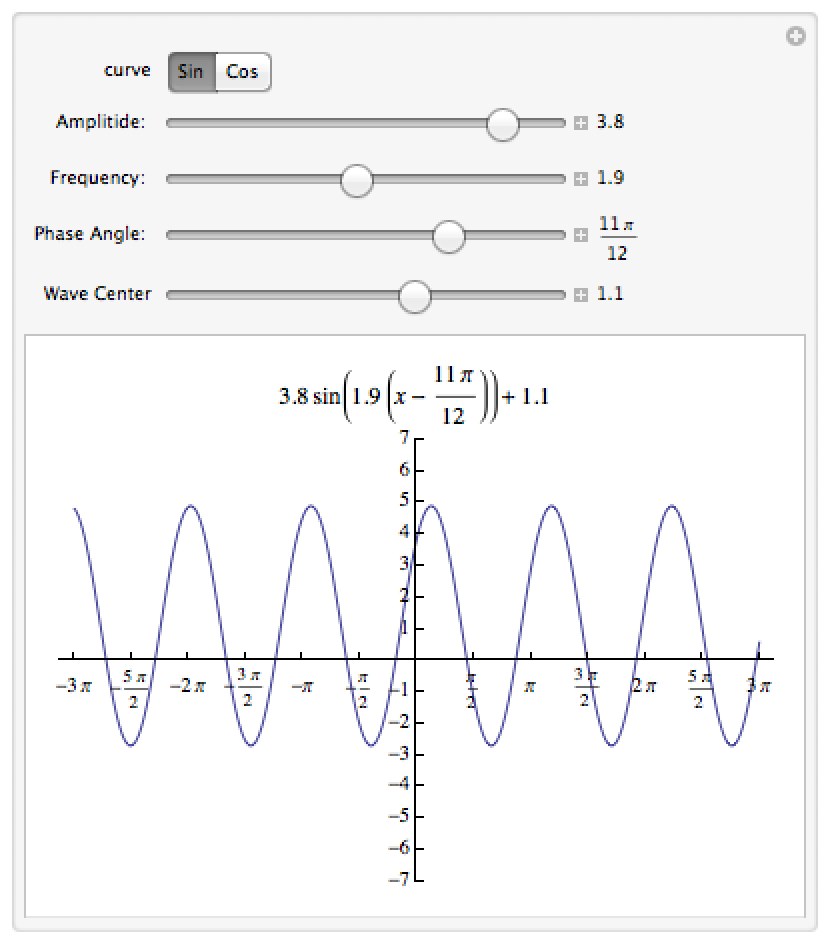
Trigonometric Waves
This notebook lets you play with the amplitude, frequency, phase angle, and vertical shift of a sinusoidal wave and see what that does to its equation.
Download this or other of my trigonometry notebooks from Google Drive
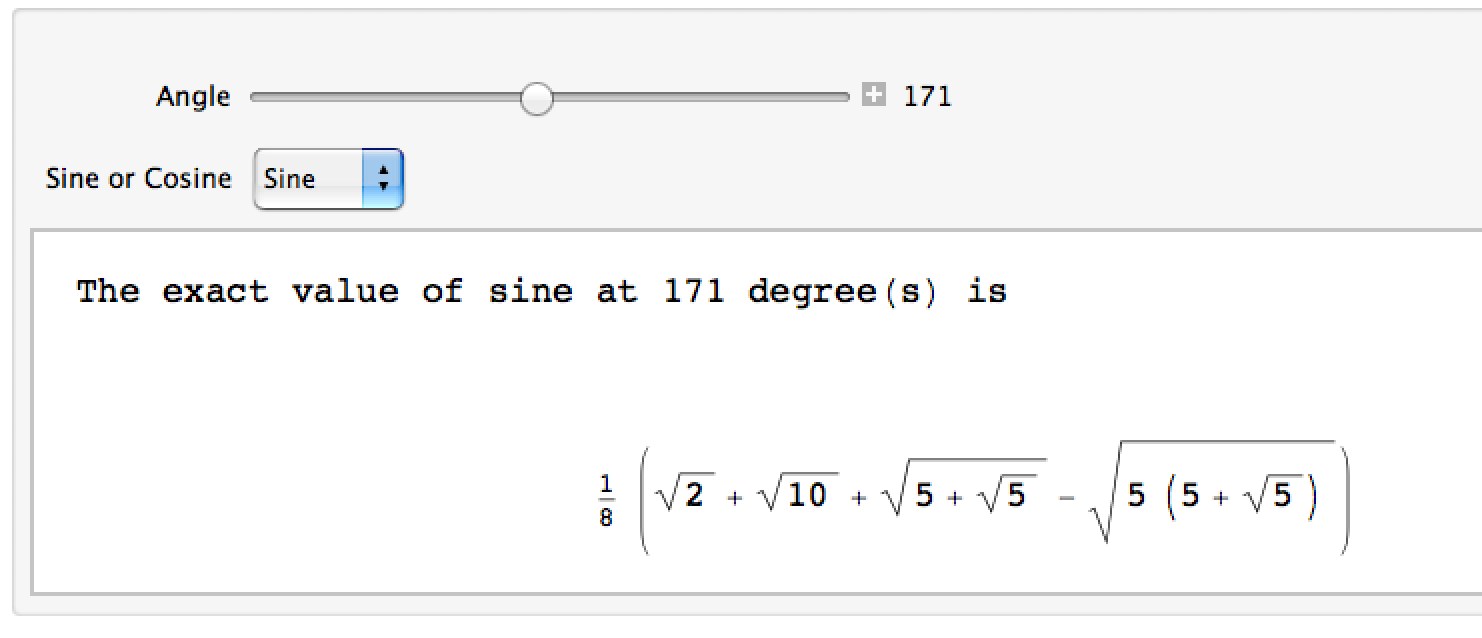
Exact values for Sine and Cosine
This notebook lets you see the exact values for sine and cosine at an integer number of degrees. The slider lets you find the values for angles whose measure is a multiple of 3; opening the slider control and entering any integer will let you see the values for other angles (like sin(1°)). A version of this can be found in the Wolfram Demonstrations Project.
Download this or other of my trigonometry notebooks from Google Drive
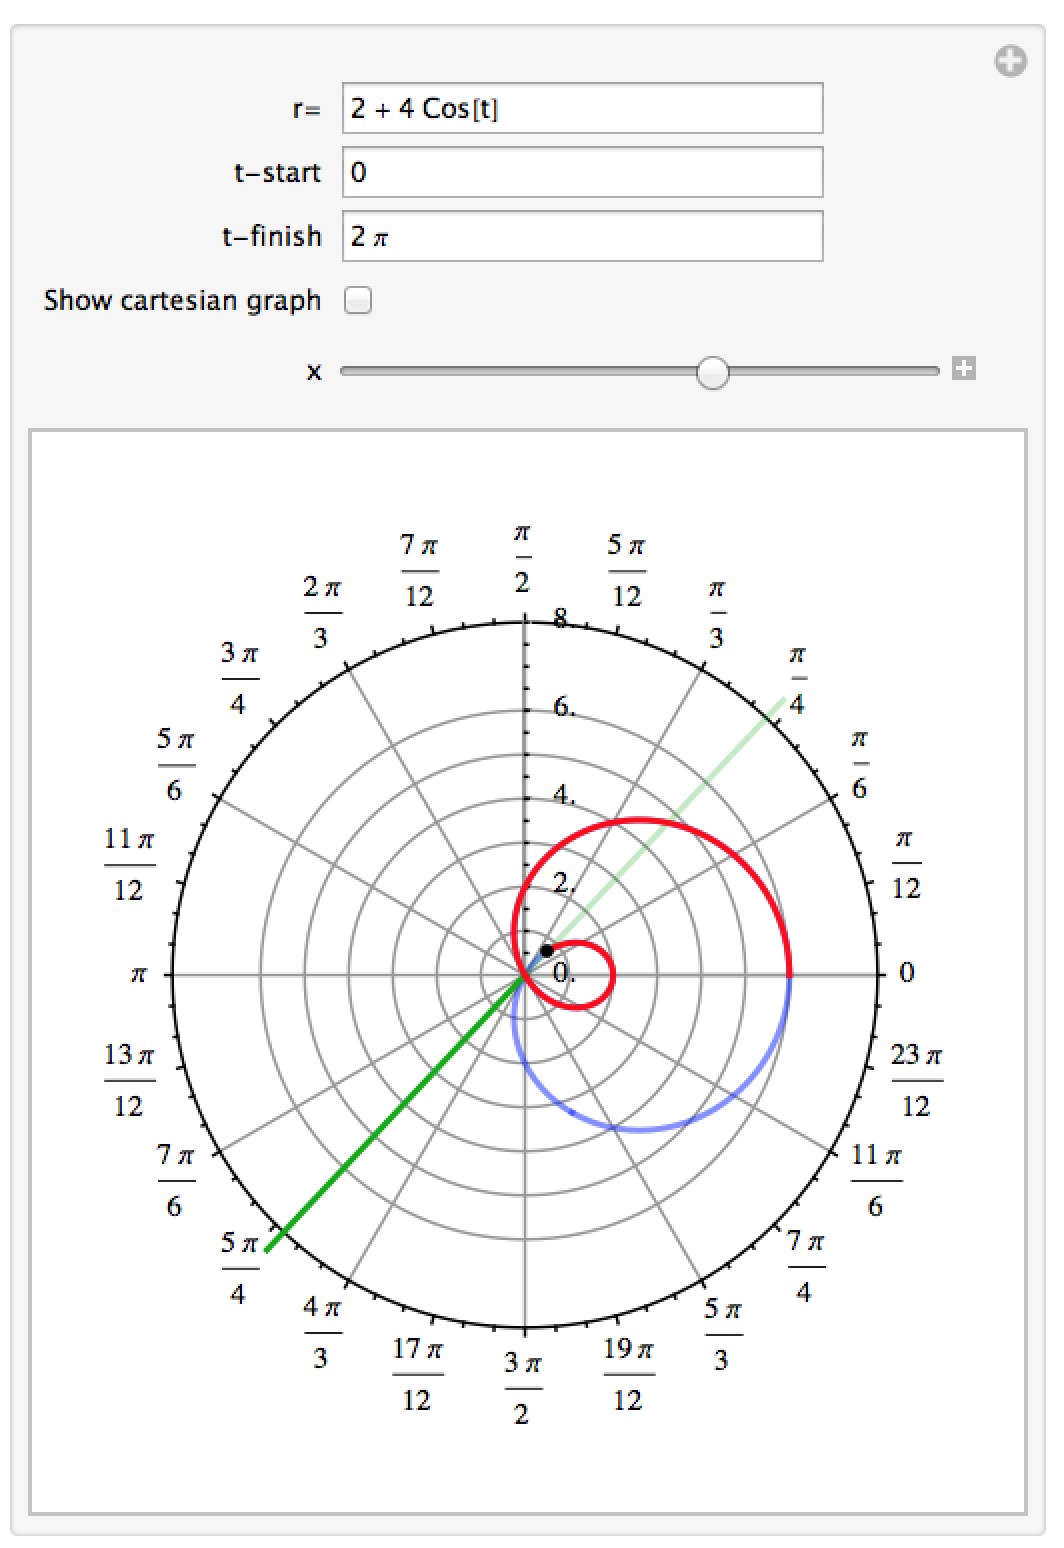
Polar Graphing
This notebook lets you graph an equation in polar coordinates and watch how the graph is sketched out as the central angle t goes from a starting value to an end value. The current angle is represented by a green line which is dark for positive radius values and light for negative ones. You can see the corresponding Cartesian graph with the polar graph side by side to see how loops and other structures are formed.
Download this or other of my trigonometry notebooks from Google Drive